 Visualization of debugging sessions
Abstract
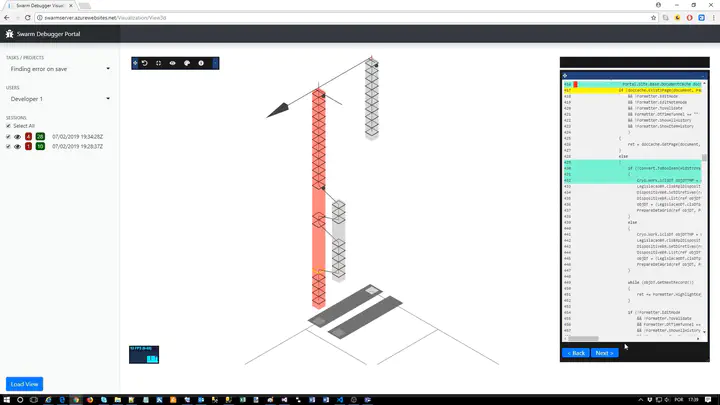
In Software Engineering, one of the most important activities is debugging. Debugging is a set of techniques to detect, locate, and correct faults in a computer program. Modern Integrated Development Environments (IDEs), such as Eclipse or Visual Studio, provide infrastructure to support interactive debugging, during which a developer explores the source code of the system under development or maintenance. Although IDEs encourage developers to work collaboratively, debugging is still an individual activity. Furthermore, interactive debugging activity is limited by IDE debugging features that do not store previous debugging sessions. This condition forces developers to repeat debugging execution sessions to review the debugging information. In this paper, using the concept of Swarm Debugging, we present the Sequence Debugging Session View (SDV) tool. The primary goal is to capture the debugging information from a developer IDE (as Visual Studio) and store it. Then, the tool enables developers to retrieve the data in 3D interactive visualization and understand software behavior through the analysis and sharing of debugging session data. The main contribution of the tool is to assist on program comprehension and to reduce effort during software maintenance. To validate the solution, we performed two usage studies in real situations at a software house. The feedback from the evaluation of the tool suggests that the team could be helped on the software arrangement.